Quick Answer: We measured 28 forex pairs over their last 250 qualifying sessions ending September 30, 2026 (Dukascopy hourly bid candles). Twenty of the 28 post their widest average hour at 14:00 UTC, inside the London/New York overlap. EUR/USD’s widest hour is 13:00 UTC at 18.2 pips and its quietest is 22:00 UTC at 6.3 pips, a 2.89x ratio. A wider hour is a volatility measurement, not a profitability one, and most retail traders lose money whichever hour they pick.
Best Time to Trade Forex: 28 Pairs by Session
The table below is the session view of the same measurement: for each pair, the mean high-to-low range of the Tokyo, London and New York windows in pips, set against the full day. London is the widest session for 26 of the 28 pairs and Tokyo for the other two. Click any column header to sort.
| Pair | Full day | Tokyo | London | New York | Overlap | Widest session | Widest ÷ quietest |
|---|---|---|---|---|---|---|---|
| GBP/JPY | 134.8 | 88.5 | 98.5 | 81.6 | 70.2 | London | 1.21x |
| GBP/NZD | 133.8 | 85.5 | 92.8 | 81.8 | 68.8 | London | 1.13x |
| CHF/JPY | 127.5 | 80.5 | 91.2 | 76.1 | 65.1 | London | 1.20x |
| GBP/AUD | 114.4 | 69.9 | 83.1 | 73.0 | 61.9 | London | 1.19x |
| EUR/NZD | 114.3 | 75.0 | 76.8 | 70.0 | 58.7 | London | 1.10x |
| EUR/JPY | 105.3 | 71.6 | 74.4 | 60.8 | 52.4 | London | 1.22x |
| USD/JPY | 103.7 | 66.6 | 71.2 | 63.8 | 52.4 | London | 1.12x |
| EUR/AUD | 98.3 | 62.0 | 69.6 | 63.1 | 54.1 | London | 1.12x |
| GBP/CAD | 94.1 | 45.7 | 74.3 | 66.4 | 54.5 | London | 1.63x |
| AUD/JPY | 91.3 | 61.6 | 62.3 | 55.6 | 47.2 | London | 1.12x |
| GBP/USD | 80.5 | 41.8 | 62.2 | 57.6 | 46.9 | London | 1.49x |
| NZD/JPY | 76.8 | 51.0 | 49.8 | 45.2 | 37.3 | Tokyo | 1.13x |
| CAD/JPY | 75.3 | 47.1 | 53.8 | 47.5 | 40.3 | London | 1.14x |
| EUR/CAD | 68.8 | 33.2 | 54.0 | 50.8 | 41.1 | London | 1.63x |
| EUR/USD | 60.4 | 31.5 | 46.0 | 43.5 | 34.9 | London | 1.46x |
| AUD/CAD | 59.0 | 35.6 | 41.5 | 39.1 | 32.3 | London | 1.17x |
| USD/CAD | 57.8 | 27.0 | 45.8 | 45.2 | 37.6 | London | 1.70x |
| AUD/NZD | 55.9 | 39.2 | 32.5 | 28.2 | 23.2 | Tokyo | 1.39x |
| GBP/CHF | 54.1 | 27.7 | 42.7 | 35.4 | 29.9 | London | 1.54x |
| AUD/USD | 54.0 | 32.4 | 38.5 | 37.4 | 30.5 | London | 1.19x |
| NZD/CAD | 54.0 | 32.3 | 35.0 | 33.8 | 26.5 | London | 1.08x |
| USD/CHF | 53.4 | 27.1 | 41.0 | 38.1 | 31.0 | London | 1.51x |
| NZD/USD | 48.8 | 29.2 | 33.0 | 32.2 | 25.6 | London | 1.13x |
| AUD/CHF | 40.6 | 23.4 | 27.9 | 24.5 | 20.7 | London | 1.19x |
| NZD/CHF | 35.1 | 18.9 | 21.1 | 19.4 | 15.5 | London | 1.12x |
| EUR/CHF | 34.2 | 18.1 | 28.0 | 23.1 | 19.7 | London | 1.55x |
| CAD/CHF | 34.2 | 15.8 | 24.8 | 23.2 | 18.6 | London | 1.57x |
| EUR/GBP | 29.6 | 15.6 | 23.9 | 20.7 | 17.6 | London | 1.53x |
As of September 30, 2026. Source: Dukascopy hourly bid candles. Figures in pips over each pair's last 250 qualifying sessions. Each session figure is the high-to-low range of that session's own UTC window on the day, not a sum of hourly ranges, so sessions that overlap in time share part of their range and the columns do not add up to the full day. Windows: Tokyo 00:00-08:59 UTC all year; London 07:00-15:59 UTC Apr–Sep and 08:00-16:59 Oct–Mar; New York 12:00-20:59 UTC Apr–Sep and 13:00-21:59 Oct–Mar. The overlap is the intersection of London and New York. The seasonal switch is by calendar month, which approximates the US and UK/EU clock changes to the nearest month. Hover a cell for the median and the session's average share of the day's range. Past ranges describe what has already happened and are not a forecast of the next session.
Sessions overlap in time, so these columns do not add up to the full day. For the underlying method, and the same table split by weekday, see the forex session volatility table and forex volatility by day of week.
Best Hours to Trade Forex: EUR/USD by UTC Hour
Sessions are broad windows. Hours are sharper, and EUR/USD is the pair most readers ask about. Same window and source as above, hourly mean range in pips (UTC and GMT are the same clock for this purpose):
| Rank | UTC hour | Mean range (pips) | Share of the day’s range |
|---|---|---|---|
| Widest 1 | 13:00 | 18.2 | 30.1% |
| Widest 2 | 14:00 | 17.9 | 29.6% |
| Widest 3 | 15:00 | 17.4 | 28.8% |
| Quietest 1 (tie) | 22:00 | 6.3 | 10.4% |
| Quietest 1 (tie) | 23:00 | 6.3 | 10.4% |
| Quietest 3 | 04:00 | 6.8 | 11.3% |
“Share of the day’s range” is the hour’s own high-to-low range divided by that day’s full 24-hour range, averaged over the 250 sessions. The shares of neighbouring hours cannot be added together, because each hour is measured on its own and the same price travel is counted in more than one of them. For the overlap as a single block, use the session table above: the London/New York overlap as one 4-hour window averages 34.9 pips, or 61.9% of the day’s range.
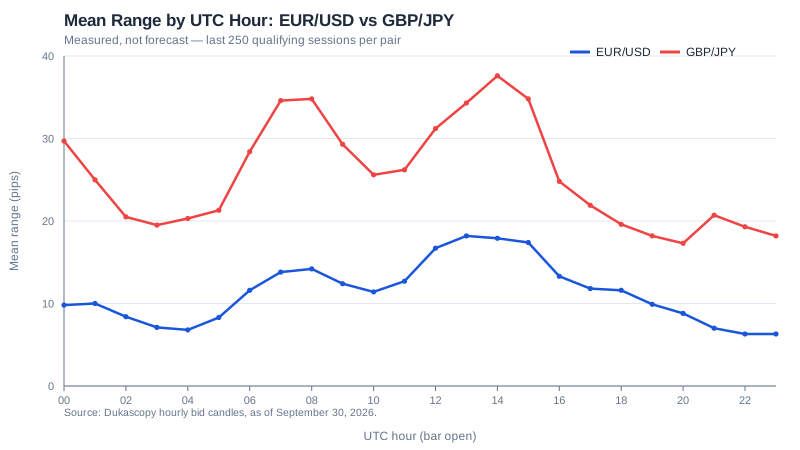
The full 28-pair by 24-hour grid is on forex volatility by hour, and EUR/USD’s daily range, which this hourly shape sits inside, is on EUR/USD average daily range in pips. One caution on the 21:00 and 22:00 UTC hours: they contain the daily 5 p.m. New York rollover, when spreads typically widen, and on bid candles a wider spread can register as range. Five of the 28 pairs show their widest hour at 21:00 UTC, an hour that contains that rollover, so we treat those five readings as a likely rollover artefact rather than a session-driven trading window.
The Four Sessions
Sydney opens the trading week. Lower volume than the other three, active mainly for AUD and NZD pairs.
Tokyo (Asian) runs 00:00-09:00 GMT and is unaffected by DST. Key pairs: USD/JPY, AUD/USD, NZD/USD.
London (European) is the heaviest-volume session, roughly 07:00-16:00 GMT in summer. Key pairs: EUR/USD, GBP/USD, EUR/GBP.
New York (American) runs roughly 12:00-21:00 GMT in summer, overlapping London’s first four hours. Key pairs: USD/CAD and USD pairs generally.
The London + New York overlap is the busiest window: highest volume, tightest spreads, strongest moves. Tokyo + London is a smaller pickup as European traders react to the overnight Asian move. If sessions are new to you, they sit inside our forex trading for beginners roadmap alongside pair choice and position sizing.
Planning a Trading Day Around the Overlaps
A walk-through in GMT using the northern-hemisphere summer session hours. Every figure is EUR/USD’s mean range per UTC hour over the 250 sessions ending September 30, 2026 (Dukascopy hourly bid candles); shift the clock hours for the current DST state before applying it (see the next section).
| GMT window | Session context | Measured hourly range (EUR/USD) | Planning read |
|---|---|---|---|
| 00:00-07:00 | Tokyo running alone | 6.8 to 11.6 pips, lowest at 04:00 (6.8) and 03:00 (7.1) | Range-based setups fit; a directional idea formed here still needs the busier hours to confirm |
| 07:00-08:00 | London opening | 13.8 pips at 07:00, up from 11.6 at 06:00 | Spreads start tightening; a point to review the overnight Tokyo move, not to chase the opening print |
| 08:00-12:00 | London running, ahead of the NY overlap | 11.4 to 14.2 pips (14.2 at 08:00) | Trend-following and breakout setups see more follow-through here than in the Tokyo hours |
| 12:00-16:00 | London + New York overlap | 16.7, 18.2, 17.9, 17.4 pips for 12:00 to 15:00, peak at 13:00 | The widest block of the day; position sizing matters most here, not less |
| 16:00-21:00 | London closing, New York alone | 13.3 pips at 16:00 falling to 8.8 at 20:00 | US data can still move price, but there is less range without London behind it |
| 21:00-24:00 | NY close, Sydney opening | 7.0, 6.3, 6.3 pips at 21:00, 22:00, 23:00 | Lowest range of the day, including the rollover effect noted above; a reasonable point to flatten day trades |
None of this is a signal. It is the measured hourly shape used as a planning frame, and the two windows we build a day around are the London open and the overlap.
Session Times Shift Twice a Year
Every “session runs from X to Y GMT” table is accurate for only part of the year, because daylight saving is not synchronised across regions:
- UK/EU shift on the last Sunday of March and of October.
- US shifts on the second Sunday of March and first Sunday of November, two to three weeks apart from the UK/EU in spring and about a week apart in autumn.
- Japan does not observe DST, so Tokyo’s GMT hours are fixed year-round.
- Australia observes DST on the opposite cycle to the Northern Hemisphere, so Sydney shifts in the reverse direction.
| Session | Local hours | GMT: N. Hemisphere winter | GMT: N. Hemisphere summer |
|---|---|---|---|
| Sydney | 09:00-17:00 | 22:00-06:00 (AEDT, DST) | 23:00-07:00 (AEST, standard) |
| Tokyo | 09:00-17:00 JST | 00:00-08:00 (no change) | 00:00-08:00 (no change) |
| London | 08:00-16:00 | 08:00-16:00 (GMT) | 07:00-15:00 (BST) |
| New York | 08:00-16:00 | 13:00-21:00 (EST) | 12:00-20:00 (EDT) |
This is also why the whole-window hourly averages above smear each session’s open across two adjacent UTC hours: EUR/USD’s widest hour is 13:00 UTC over the full year, and a fixed UTC hour is a different point in the London or New York day depending on the season.
Most MT4/MT5 brokers, XM included, do not run the platform clock on GMT. They use a floating offset, commonly GMT+2 in winter and GMT+3 in summer, tracking Eastern European Time. Because that offset shifts on the same dates as London’s own clock, London’s broker server-time window is constant year-round: 08:00+2 in winter = 07:00+3 in summer = 10:00 server time, giving 10:00-19:00 both seasons. New York works out constant too, at 15:00-00:00, but only once both the US and EU have finished their own transition for the season. Confirm your own broker’s stated offset rather than assuming GMT+2/+3.
What Actually Changes Between Sessions
Spread behaviour. Tightest when liquidity is deepest (London and the overlap) and widest during the Sydney/Tokyo handoff and around the NY close, when fewer market makers are quoting. See understanding spreads and commissions.
Liquidity. More participants means orders fill closer to the quoted price; thin liquidity means the same order size moves price further.
Which data lands when. European releases land in the London morning; US releases land in the NY morning, often inside the overlap.
Month-end fix flows. The WM/Reuters 4pm London fix concentrates rebalancing orders around 16:00 London time, most visibly on the last trading day of the month and unrelated to any news event.
Setting EA Trading Hours
Most EAs restrict trading to a configured hour window, in GMT or the broker’s server time. Two things go wrong in practice: mixing up which one your input is in (a GMT figure entered where the EA expects server time trades two or three hours off target) and filters calibrated once and never revisited. A filter set to “12:00-16:00 server time” drifts during the two-to-three-week stretch each spring, and roughly one week each autumn, when the US and EU sit on different DST states. New York, the one session here without a stable year-round offset, moves an hour relative to the filter during exactly those weeks. Recheck hour filters at each DST changeover, not just once at setup.
Best Times for Each Strategy
| Strategy | Window that fits | Why |
|---|---|---|
| Trend following (SteadyPips) | London, London+NY overlap | Strongest directional moves form here |
| Grid trading (GridMaster) | Tokyo, other quiet periods | Ranges suit grid spacing better than trending moves |
| Scalping | London+NY overlap | Tightest spreads relative to movement |
| Swing trading | Any | Holds across multiple sessions by design |
Times to Avoid
- Sunday open (~22:00 GMT): thin liquidity, wide spreads, possible weekend gaps
- Friday close (~21:00 GMT): liquidity draining ahead of the weekend
- Major holidays: thin markets, erratic moves
- Scheduled high-impact news, unless the strategy is built for it
Frequently Asked Questions
What is the best time to trade forex?
There is no single hour for every pair, but the measured pattern is clear. Across 28 pairs, 20 post their widest average UTC hour at 14:00, inside the London/New York overlap, and London is the widest session for 26 of the 28 (Dukascopy hourly bid candles, last 250 qualifying sessions, as of September 30, 2026). Widest is a volatility measurement, not a profitability one.
What is the best time to trade EUR/USD?
EUR/USD’s widest average hour is 13:00 UTC at 18.2 pips, with 14:00 at 17.9 and 15:00 at 17.4. By session London is widest at a mean of 46.0 pips, against 43.5 for New York and 31.5 for Tokyo, on the same 250 sessions as of September 30, 2026. That describes where the range has been, not where a profitable entry is.
What are the worst hours to trade forex?
The lowest measured ranges sit late in the New York day and in the Tokyo small hours. On EUR/USD the quietest hours are 22:00 and 23:00 UTC at 6.3 pips each and 04:00 UTC at 6.8 pips, as of September 30, 2026. Across 28 pairs the quietest hour is 04:00 UTC for 8 pairs and 23:00 UTC for 7. Low range describes past movement; it is not a verdict that those hours cannot be traded.
Why do session times in GMT change twice a year?
Daylight saving. The UK/EU shift on the last Sunday of March and October; the US shifts on the second Sunday of March and first Sunday of November. Japan does not observe DST, so Tokyo’s GMT hours never move, and Australia’s DST runs on the opposite cycle, so Sydney shifts the other way.
Why did my EA’s trading-hours filter stop working correctly?
Most hour filters use a fixed GMT or server-time window. Because the US and EU shift daylight saving on different dates, several weeks each spring and autumn put New York’s session an hour off from where the filter expects it. The filter does not self-correct, so recheck it at each DST transition.
- Forex Volatility by Hour: the full 28-pair by 24-hour table
- Forex Session Volatility Table: Tokyo, London and New York range in pips for 28 pairs
- Most Volatile Day of the Week in Forex: the same pairs split by weekday
- EUR/USD Average Daily Range in Pips: the daily range behind the hourly shape
- Best Currency Pairs for Beginners: which pairs move most in which session
- Grid Trading Strategy: Complete Guide: why grid systems care about session volatility too
Best time to trade, pair by pair
- Best time to trade AUD/CAD
- Best time to trade AUD/CHF
- Best time to trade AUD/JPY
- Best time to trade AUD/NZD
- Best time to trade AUD/USD
- Best time to trade CAD/CHF
- Best time to trade CAD/JPY
- Best time to trade CHF/JPY
- Best time to trade EUR/AUD
- Best time to trade EUR/CAD
- Best time to trade EUR/CHF
- Best time to trade EUR/GBP
- Best time to trade EUR/JPY
- Best time to trade EUR/NZD
- Best time to trade EUR/USD
- Best time to trade GBP/AUD
- Best time to trade GBP/CAD
- Best time to trade GBP/CHF
- Best time to trade GBP/JPY
- Best time to trade GBP/NZD
- Best time to trade GBP/USD
- Best time to trade NZD/CAD
- Best time to trade NZD/CHF
- Best time to trade NZD/JPY
- Best time to trade NZD/USD
- Best time to trade USD/CAD
- Best time to trade USD/CHF
- Best time to trade USD/JPY
This article is for educational purposes only. Trading forex carries significant risk. Past performance is not indicative of future results.