What Is Grid Trading?
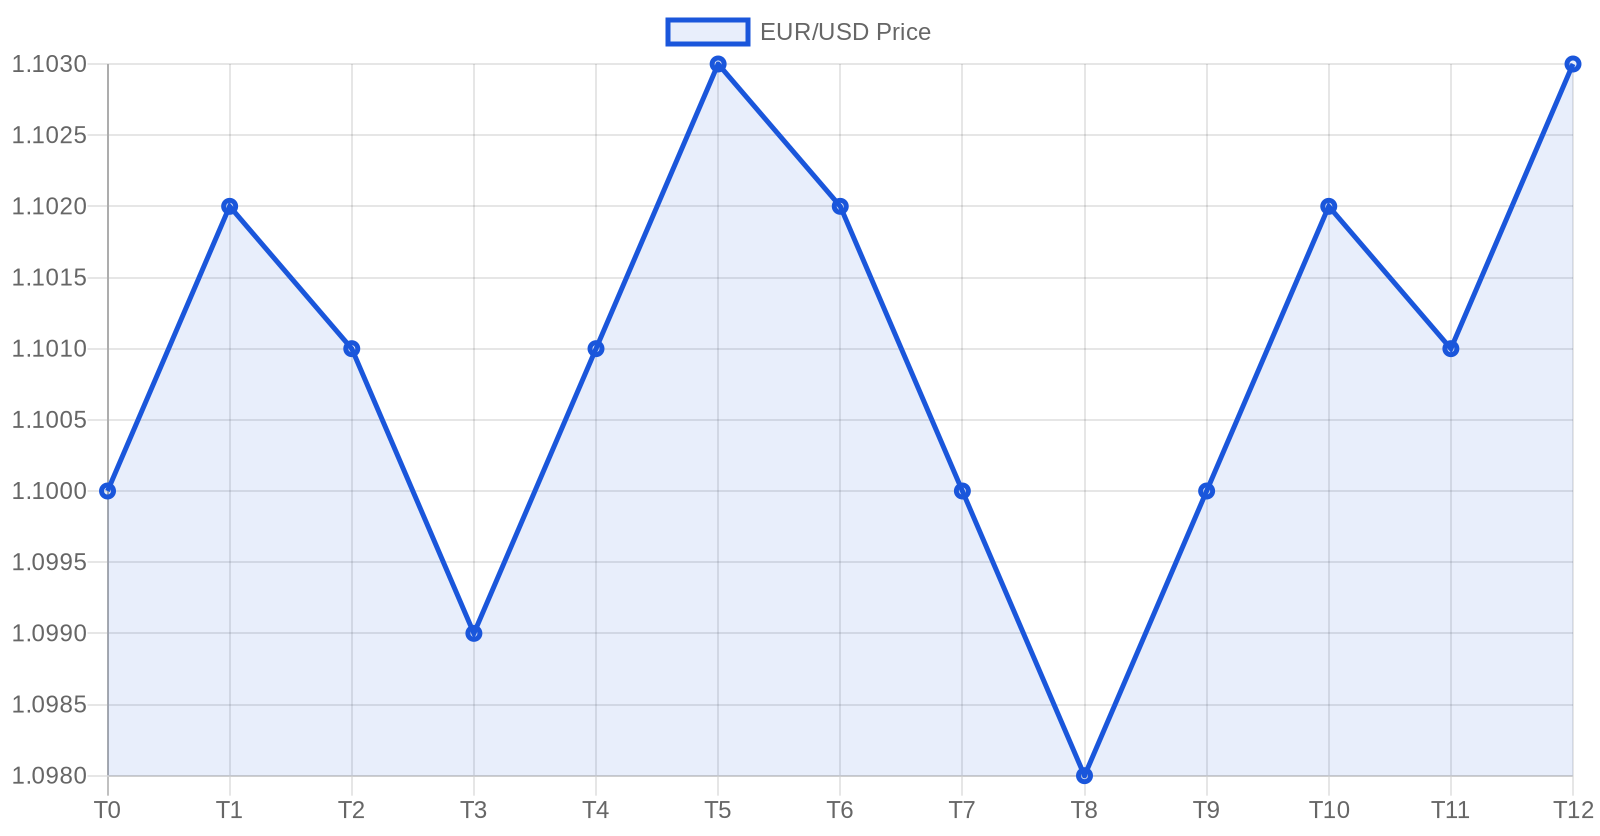
A grid trade is a single buy or sell order placed at a fixed price interval around a central price — one rung in a ladder. Grid trading is the strategy of running many of these orders at once: instead of predicting market direction, it profits from price moving up and down within a range.
Think of it like casting a net across the price chart. As price oscillates, each grid trade triggers and closes at a fixed profit — automatically, regardless of which way the market ultimately goes.
This page answers the definition question and then works one complete grid through by hand — the profit arithmetic and the drawdown arithmetic, both. It stops there deliberately. Once the concept is clear, three companion pages take it further: the grid trading strategy guide for spacing, sizing, and risk rules; how to set up grid trading for the step-by-step build; and dynamic grid trading for the version that adjusts its spacing to volatility instead of holding it fixed.
Grid Trading at a Glance
| Question | Answer |
|---|---|
| What is a grid trade? | One buy or sell order placed at a fixed price interval around a central anchor price. |
| What does the strategy profit from? | Price oscillating inside a range, not the direction the market ultimately takes. |
| Best market condition | Range-bound, lower-volatility periods. |
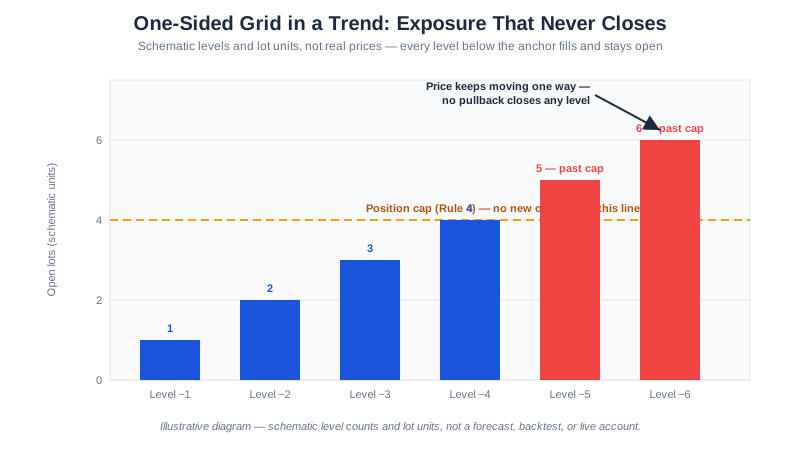
| Worst market condition | A sustained one-way trend, which fills every level on the losing side. |
| Typical EUR/USD spacing | 15–25 pips. |
| Typical GBP/JPY spacing | 30–50 pips. |
| Take profit per order | Equal to one grid spacing. |
| Practical minimum capital | About $1,000 at 0.01 lots (see the capital table below). |
| Automation suitability | High — the rules are fixed and contain no subjective decision. |
As of this guide’s August 2026 revision, SteadyPips uses 15–25 pip grid spacing for EUR/USD and 30–50 pips for a more volatile pair such as GBP/JPY, with each order’s take profit set equal to one spacing interval. Grid trading’s defining risk is unchanged by any of those numbers: a sustained one-way move fills every level on the losing side and the floating loss grows with the distance travelled.
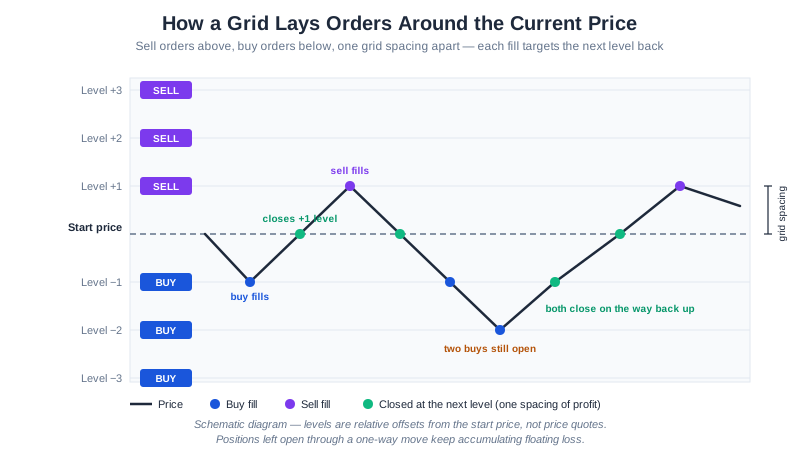
The diagram above is deliberately schematic: the levels are offsets from wherever price happens to be when the grid starts, not particular quotes. That is the whole point of a grid — the structure is the same regardless of where the market is trading.
How Does Grid Trading Work? Step by Step
Grid trading is mechanical, which is why it is easy to describe as a sequence. Here is the whole cycle, in the order it actually happens.
Step 1 — Pick an anchor price. Whatever the pair is trading at when you start becomes the centre of the ladder. A grid has no opinion about whether that price is high or low; it only cares that price will move away from it and come back.
Step 2 — Choose a spacing. The spacing is the fixed distance between rungs, quoted in pips. It is the single number that determines how often the grid trades and how much capital each fill consumes.
Step 3 — Place the ladder. Sell orders go above the anchor, one spacing apart. Buy orders go below, one spacing apart. Both sides are placed at the same time, because you are not predicting a direction.
Step 4 — Wait for price to trigger a rung. A move down fills buy orders on the way through. A move up fills sell orders. Nothing is decided in the moment — the orders were already resting.
Step 5 — Each filled order targets one spacing back. A buy filled at 1.0780 in a 20-pip grid takes profit at 1.0800. That is the entire profit logic: one rung of retracement closes one position.
Step 6 — Closed levels are replaced. When a level closes in profit, a fresh order is usually placed back at the same price so the ladder stays intact for the next oscillation.
Step 7 — Unclosed levels accumulate. This is the step most explanations skip. If price keeps going one way, the orders behind it never reach their target. They stay open, and their combined floating loss grows — the arithmetic for exactly how fast is in the worked example below.
Steps 2 through 7 above assume the spacing is a constant. It does not have to be — in dynamic grid trading the interval is recalculated from current volatility, so the same grid uses a narrower ladder in a quiet session and a wider one when the market speeds up.
Grid Trading Example: A Worked EUR/USD Grid
Definitions only get you so far. Here is a complete small grid with the arithmetic written out.
These are illustrative figures, not results. The prices are round numbers chosen so the arithmetic is checkable by hand, and the outcomes below are what the formula produces — not a backtest, not a forecast, and not what any account earned. Our actual tested figures, with their limitations, live on the performance page.
The setup
| Parameter | Value |
|---|---|
| Pair | EUR/USD |
| Anchor price | 1.0800 |
| Grid spacing | 20 pips |
| Levels per side | 5 |
| Lot size per level | 0.01 (micro lot) |
| Pip value at 0.01 lots | $0.10 |
| Take profit per order | 20 pips (one spacing) |
The ladder that produces:
SELL 1.0900  → TP 1.0880
SELL 1.0880  → TP 1.0860
SELL 1.0860  → TP 1.0840
SELL 1.0840  → TP 1.0820
SELL 1.0820  → TP 1.0800
─── anchor: 1.0800 ───
BUY  1.0780  → TP 1.0800
BUY  1.0760  → TP 1.0780
BUY  1.0740  → TP 1.0760
BUY  1.0720  → TP 1.0740
BUY  1.0700  → TP 1.0720
What one completed round trip is worth
The core multiplication is spacing × pip value × lot size:
20 pips × $0.10 per pip (0.01 lots) = $2.00 gross per round trip
Trading costs come straight off that. At a 1.0-pip spread the effective capture is 19 pips, so each round trip nets about $1.90 rather than $2.00 — a 5% haircut on every single trade. That ratio is why tight spacing on a wide-spread pair does not work: at 10-pip spacing the same 1.0-pip spread takes 10% of every win. See understanding spreads and commissions for the full cost stack.
If price oscillates around the anchor and completes four round trips in a session, the gross is 4 × $2.00 = $8.00, or about $7.60 after that spread assumption. On a $1,000 account that is roughly 0.8% — small, which is the honest shape of the strategy. Grid trading accumulates many small captures; it does not produce large single wins.
What the same grid costs when price does not come back
Now run the unpleasant case. Price falls in a straight line from 1.0800 to 1.0700, filling all five buy levels and closing none of them. Each open position is underwater by its distance from the current price:
| Level | Entry | Distance to 1.0700 | Floating loss at 0.01 lots |
|---|---|---|---|
| 1 | 1.0780 | 80 pips | $8.00 |
| 2 | 1.0760 | 60 pips | $6.00 |
| 3 | 1.0740 | 40 pips | $4.00 |
| 4 | 1.0720 | 20 pips | $2.00 |
| 5 | 1.0700 | 0 pips | $0.00 |
| Total | $20.00 |
That total has a closed form worth memorising. With n levels filled, spacing s in pips, and pip value v, the floating loss when price is sitting exactly at the last filled level is:
floating loss = v × s × n(n−1)/2
             = $0.10 × 20 × (5 × 4 / 2)
             = $20.00
The n(n−1)/2 term is the important part: the loss grows with the square of the number of filled levels, while profit only ever accrues one spacing at a time. Ten filled levels instead of five is not twice the floating loss, it is $0.10 × 20 × 45 = $90.00 — four and a half times as much.
And it does not stop when the ladder runs out. If price continues another 100 pips to 1.0600 with all five positions still open and no further levels to fill, every position loses another 100 pips:
extra loss = 5 positions × 100 pips × $0.10 = $50.00
total floating loss = $20.00 + $50.00 = $70.00
On a $1,000 account that is a 7% floating drawdown from a 200-pip move — which EUR/USD can produce inside a single week. Set against $1.90 per round trip, recovering that $70 would take roughly 37 completed round trips. That asymmetry — squared losses against linear gains — is the entire risk of grid trading in one sentence, and it is why the risk-control section below is not optional reading.
Reading the example correctly
Two honest caveats before anyone extrapolates from those numbers:
- Nothing above says the grid wins. It says what each outcome is worth if it happens. Whether the round trips outnumber the trend damage over months is an empirical question, and the answer depends on the pair, the regime, and the risk caps.
- The 200-pip move is not the worst case. It is a moderate case chosen for round arithmetic. A sustained trend can travel much further, and the same formula keeps applying.
When Does Grid Trading Work Best?
Grid trading thrives in specific market conditions:
Best conditions:
- Range-bound markets — price oscillating between support and resistance
- Low-volatility periods — Asian session for EUR/USD, quiet market phases
- Stable pairs — USD/CHF, EUR/GBP, and other pairs that tend to range
When to avoid grid trading:
- Strong trends — price moving consistently in one direction traps grid orders
- High-impact news — NFP, FOMC, ECB decisions cause sharp directional moves
- Low liquidity — holiday periods when spreads widen
Grid Trading vs Other Strategies
| Feature | Grid Trading | Trend Following | Scalping |
|---|---|---|---|
| Market direction needed? | No | Yes | Yes |
| Best market condition | Ranging | Trending | Volatile |
| Trade frequency | High | Low-Medium | Very High |
| Drawdown risk | High in trends | Moderate | Low per trade |
| Automation friendly? | Very | Yes | Difficult |
| Time commitment | Low (automated) | Medium | High |
Grid trading’s biggest advantage is direction independence — you don’t need to predict where the market is going. Its biggest risk is drawdown during trends, which is why risk management is critical.
Risk Management for Grid Trading
Grid trading can accumulate significant losses if price trends strongly in one direction. Here’s how to manage this risk:
Essential Safeguards
- Set a maximum number of open orders — prevents unlimited exposure during strong trends
- Use a drawdown limit — stop opening new grid orders if account drawdown exceeds a threshold (e.g., 20%)
- Equity stop-loss — close all positions if total equity drops below a safety level
- Proper capitalization — grid trading requires more margin than single-trade strategies. A minimum of $1,000 is recommended for micro lots
- Choose appropriate grid spacing — too tight wastes on spreads, too wide requires more capital
How Much Capital Do You Need?
The capital requirement depends on your grid settings:
| Grid Levels | Spacing | Min. Lot | Approximate Capital Needed |
|---|---|---|---|
| 5 per side | 20 pips | 0.01 | $500–$800 |
| 8 per side | 20 pips | 0.01 | $1,000–$1,500 |
| 10 per side | 25 pips | 0.01 | $1,500–$2,000 |
These are rough guidelines. Always test on a demo account first.
Frequently Asked Questions
What does grid trading stand for?
Nothing — “grid” is not an acronym or an abbreviation for anything. The name is purely descriptive: orders spaced at equal price intervals above and below an anchor form a grid, or ladder, across the chart. If you have seen it written as GRID in capitals, that is someone’s formatting choice, not an initialism. The related term grid trade refers to one individual order in that ladder rather than the strategy as a whole.
Is grid trading profitable?
Grid trading can be profitable in ranging markets, and it can lose heavily in trending ones. No strategy guarantees profits. The specific reason grid trading is dangerous is the asymmetry shown in the worked example above: winning round trips pay one spacing each, while the floating loss on the unclosed side grows with the square of how many levels have filled. A 200-pip adverse move in that example produced a $70 floating loss that would take about 37 winning round trips to recover. Grid trading suits a trader who has matched it to a ranging regime and enforces hard drawdown limits — not one looking for a strategy that works unattended in all conditions.
What is a grid trade?
A single buy or sell order resting at one rung of the ladder, with a take profit set one spacing away. The strategy is the whole ladder; a grid trade is one order within it.
Is grid trading good for beginners?
Grid trading concepts are easy to understand, but managing the risk requires experience. Beginners should start on a demo account and use an EA with built-in risk protection rather than placing grid orders manually.
What is the best grid spacing?
Grid spacing should match the pair’s volatility. For EUR/USD, 15–25 pips works well. For more volatile pairs like GBP/JPY, use 30–50 pips. A general formula: grid spacing = 1.5 × average daily range ÷ number of grid levels.
Can grid trading be automated?
Yes — grid trading is one of the most automation-friendly strategies because it follows fixed rules with no subjective decision-making. An Expert Advisor (EA) can place, manage, and close grid orders 24/5 without manual intervention.
What pairs are best for grid trading?
Pairs that tend to range: EUR/GBP, USD/CHF, AUD/NZD, and EUR/USD during the Asian session. Avoid highly trending or low-liquidity pairs.
Automate Your Grid Trading with a Free EA
Managing a grid manually is tedious and error-prone. Our free GridMaster EA automates the entire process:
- Automatic grid placement and order management
- 5 layers of built-in risk protection (max orders, drawdown limit, equity stop, lot cap, weekend close)
- Configurable spacing, levels, and lot sizing
- Works on MetaTrader 4 or MetaTrader 5 with any broker
Download GridMaster EA for free →
Further Reading
- Grid Trading Strategy: Complete Guide — the strategy hub: spacing, sizing, and the rule-based blueprint
- How to Set Up Grid Trading in Forex — the 10-step build, from pair choice to going live
- Dynamic grid trading explained — the variant that sizes its spacing from ATR instead of a fixed number
- Best Forex Pairs for Grid Trading — 7 pairs ranked by range behavior and spread cost
- Our full GridMaster risk and feature assessment — what the EA does well and where it breaks
- GridMaster parameter settings by account size — Conservative, Moderate, and Aggressive presets
- Forex Risk Management Guide — protect your trading capital
- What Is an Expert Advisor? — learn about automated trading
This article is for educational purposes only and does not constitute financial advice. Grid trading involves significant risk, including the potential for large drawdowns during trending markets. Past performance is not indicative of future results. Never trade with money you cannot afford to lose.
![Best Forex Pairs for Grid Trading: 7 Pairs Ranked [2026]](/images/charts/best-forex-pairs-for-grid-trading-ranging-vs-trending.svg)